
StatPecker
StatPecker transforms your data into fast, stunning visuals and actionable insights while ensuring your privacy and.
AI tool Details
Alternatives
About StatPecker
StatPecker is an innovative AI-driven tool designed to revolutionize the way users transform raw data into stunning, visually engaging infographics within seconds. This powerful platform caters to a diverse audience, including content creators, data analysts, marketers, and educators, all of whom depend on eye-catching visuals to convey insights effectively. StatPecker automates the intricacies of data storytelling, significantly saving time and reducing the costs typically associated with manual reporting and design services. By enabling users to convert complex data sets into engaging visuals, StatPecker enhances both the clarity and impact of the information presented. Users can effortlessly extract trends, visualize comparisons, and simplify complex topics, empowering them to make informed, data-driven decisions while sharing their findings in a captivating manner. With StatPecker, the future of data visualization is not just accessible but also exciting and efficient.
Features
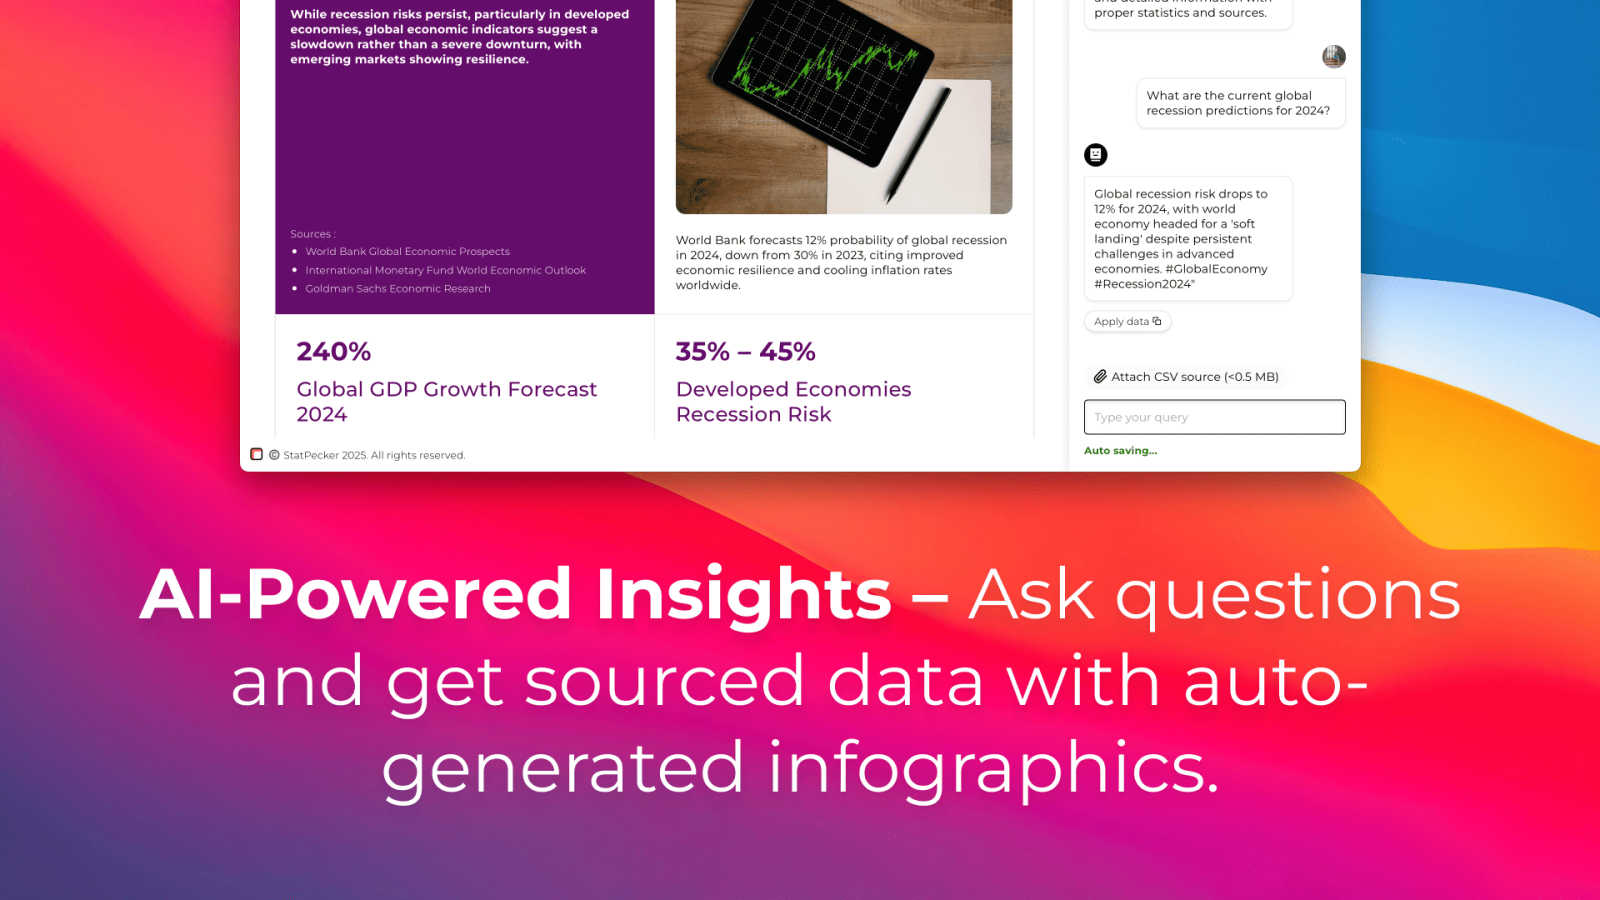
Ask Your Query
StatPecker allows users to gain instant insights from validated sources using artificial intelligence. There's no need for complex tools or technical know-how; simply ask your question and receive actionable answers that enhance your understanding of the data at hand.
Publish & Embed
With the ability to create interactive visuals, StatPecker makes it easy to integrate your infographics into blogs, articles, and websites. This feature allows users to enhance their content with dynamic visuals that engage audiences and elevate the overall quality of presentations.
Upload & Analyze CSVs
Users can upload CSV files of up to 50 MB and perform on-device analysis without the hassle of spreadsheets. This feature ensures that data remains private while allowing users to extract essential insights and generate visuals that can be shared or embedded seamlessly.
Download & Use Anywhere
StatPecker enables users to export their infographics as images, making them versatile for reports, presentations, and various other applications. This feature ensures that users can utilize their creations across different platforms, ensuring their insights reach the intended audience effectively.
Use Cases
Content Creation
Content creators can leverage StatPecker to transform statistical data into visually appealing infographics that enhance storytelling. By using engaging visuals, creators can better capture their audience's attention and effectively communicate key messages.
Marketing Campaigns
Marketers can utilize StatPecker to visualize campaign data, enabling them to present insights and results in a compelling manner. This enhances the ability to showcase the effectiveness of marketing strategies and drive further engagement from stakeholders.
Educational Purposes
Educators can harness StatPecker to create informative infographics that simplify complex topics for students. By breaking down intricate data into easily digestible visuals, educators can enhance learning and retention among their students.
Business Analytics
Data analysts can use StatPecker to quickly visualize trends and patterns within business datasets. This allows for faster decision-making and clearer communication of insights to management and team members, ultimately supporting data-driven strategies.
Frequently Asked Questions
How does StatPecker ensure data privacy?
StatPecker prioritizes data security by performing on-device analysis, ensuring that uploaded files remain private and are not sent to external servers for processing.
Can I use StatPecker for free?
Yes, StatPecker offers a free tier that allows users to create unlimited projects and embeds with certain limitations, making it accessible for anyone looking to enhance their data storytelling capabilities.
What file formats does StatPecker support for uploads?
Currently, StatPecker supports CSV file uploads of up to 50 MB, enabling users to analyze and visualize their data without the complexity of traditional spreadsheet tools.
How can I embed the infographics created with StatPecker?
Once you create your infographic, StatPecker provides options to publish and embed the visuals directly into your blogs, articles, or websites, ensuring easy integration and sharing.
Similar to StatPecker


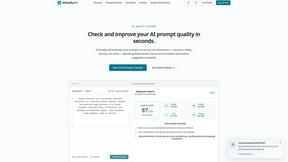
AIQualityHQ
Unlock your AI's full potential by transforming vague prompts into precise, secure instructions with instant quality scores and actionable fixes.
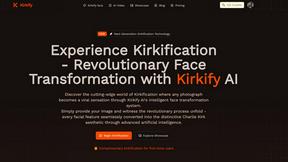
Kirkify
Kirkify AI instantly transforms any photo into viral, Kirkified memes using advanced face-swap and AI video tools for creators and marketers.
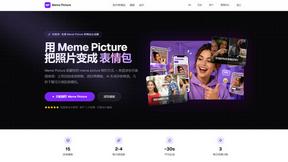
Meme Picture
Meme Picture transforms your selfies and pet photos into hilarious classic memes in seconds with free daily AI generations and no login required.
Anime Maker
Transform any idea into stunning anime images, characters, and short videos with powerful AI, unlocking your creative potential.

Masset
Masset unifies your scattered business content into a single AI-powered hub so your tools and team always tell the right story.