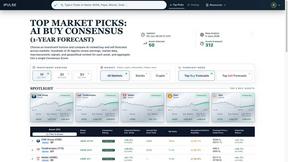
Dividend Data
Transform your spreadsheets with instant, automated stock data for smarter investment analysis.
AI tool Details
Explore More
Alternatives

About Dividend Data
Dividend Data is a game-changing financial data platform designed to transform how individual investors conduct research and manage portfolios. It shatters the traditional barriers to institutional-grade market data by delivering over 30 years of historical information for more than 80,000 tickers directly into the tools investors already use: Google Sheets and Microsoft Excel. The core value proposition is profound simplicity—no complex API integrations, no coding knowledge, and no tedious manual copying and pasting are required. Built by a dividend investor for the community, it provides instant, live access to a comprehensive suite of data including dividend histories, yields, payout ratios, growth rates, complete financial statements, key valuation ratios, and real-time price quotes through intuitive custom spreadsheet formulas. This empowers fundamental and dividend-focused investors to make data-driven decisions with the same depth of information as professional analysts, but without the prohibitive cost. With a permanently free tier offering 2,500 monthly credits, Dividend Data is unlocking potential and democratizing access to high-quality financial intelligence for everyone.
Features
Seamless Spreadsheet Integration
Transform your Google Sheets or Microsoft Excel into a powerful, automated investment research terminal. By using simple, custom formulas like =DIVIDENDDATA_DIVIDENDS("TICKER"), you can pull live, institutional-grade data directly into your cells. This eliminates the need for error-prone manual data entry, external API keys, or any programming, making sophisticated analysis accessible to every investor instantly within their familiar workflow.
Comprehensive Dividend & Fundamental Data Suite
Access a deep well of over 100 critical metrics essential for thorough fundamental analysis. The platform provides exhaustive data on dividends, including forward yields, ex-dates, payment histories, and growth rates. Beyond dividends, it delivers complete financial statements (income, balance sheet, cash flow), key ratios (P/E, P/B, Debt/Equity), earnings metrics, and decades of price history, all updated automatically to ensure your models and screens are always current.
AI-Powered Research Assistant
Elevate your due diligence with an integrated AI Analyst. This transformative feature allows you to chat with an AI-powered assistant to ask complex questions about stocks, generate research summaries, compare companies, and uncover insights from the vast dataset. It acts as a personal research associate, helping you cut through the noise and focus on the most critical investment signals faster than ever before.
Automated Portfolio Tracking & Visualization
Move beyond static spreadsheets with automated portfolio tracking. The Dividend Data Terminal web app allows you to link your investment portfolios for real-time aggregation of key statistics. Automatically track overall dividend income, yield on cost, sector allocation, and performance metrics. The platform provides great data visualizations to help you understand your portfolio's health and income trajectory at a glance.
Use Cases
Building a Dividend Growth Screen
Easily construct and maintain a dynamic screen for dividend growth stocks. By using formulas to pull dividend growth rate history, payout ratios, and current yield for thousands of stocks, you can create a live, filterable list of companies that have consistently raised their dividends. This automates the most time-consuming part of the process, allowing you to focus on qualitative analysis of the shortlisted candidates.
Creating a Live Financial Model
Develop a discounted cash flow (DCF) or dividend discount model (DDM) that updates automatically. Link your model's assumptions directly to Dividend Data formulas for revenue, EPS, and dividend forecasts. When new quarterly data is released, your model's inputs and intrinsic value calculations refresh instantly, giving you a persistent, up-to-date valuation tool for any company in your watchlist.
Conducting Comparative Company Analysis
Perform rapid, apples-to-apples comparisons between multiple investment candidates. Pull key valuation ratios, profitability margins, and balance sheet health metrics for several companies into a single spreadsheet. This side-by-side view, powered by live data, enables you to quickly identify which company offers the best relative value, financial strength, or income potential for your portfolio.
Monitoring Portfolio Health & Income
Gain a real-time, holistic view of your investment portfolio's performance and income stream. By using the portfolio tracking feature or building a summary sheet with formulas linked to your holdings, you can automatically track aggregate metrics like total dividend income, portfolio yield, upcoming ex-dividend dates, and sector concentration, ensuring you are always informed and in control.
Frequently Asked Questions
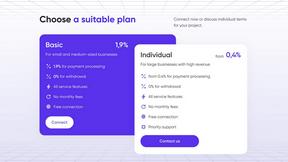
How does the free tier work?
The free tier is designed to be genuinely useful and has no trial expiration. It provides 2,500 credits per month, which you can use to make data calls within Google Sheets or Excel. Each cell that pulls data (e.g., one formula) typically consumes one credit. This allows for substantial monthly analysis, making it a powerful starting point for individual investors without any credit card required.
What data sources does Dividend Data use?
Dividend Data aggregates and cleans data from multiple reputable financial data providers to ensure accuracy and comprehensiveness. The platform synthesizes this information to deliver a consistent, reliable stream of fundamental and market data, including 30+ years of historical data points, directly to your spreadsheet or terminal.
Do I need to know how to code to use this?
Absolutely not. Dividend Data is built specifically to require zero coding knowledge. The entire platform is accessed through simple, plain-English formulas in your spreadsheet (like =DIVIDENDDATA_QUOTE("MSFT", "price")) or through the intuitive point-and-click web terminal. The complexity of data sourcing and API management is handled entirely behind the scenes.
Is my data and portfolio information secure?
Yes. Dividend Data takes security seriously. Your portfolio data and usage information are protected. The company has a clear privacy policy, and the connection for fetching data is secure. For spreadsheet users, your portfolio data typically resides only in your local spreadsheet file unless you choose to use the separate, secure web terminal for portfolio linking and tracking.
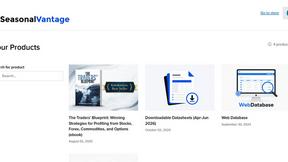
Similar to Dividend Data

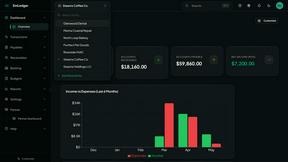
EmLedger
Transform your accounting with EmLedger, the unified platform for real double-entry accounting across all your entities for one flat fee.
Decker
Decker transforms your expertise into a monetized operating system that ships review-ready deliverables and unlocks earnings from your AI workflows.

Liners Africa
Liners Africa unlocks smarter software decisions by combining tireless AI agents with human research to discover, compare, and review African.

FX Radar
FX Radar delivers real-time forex and financial news in seconds, empowering traders with powerful tools to analyze and optimize their performance.