KPI Studio
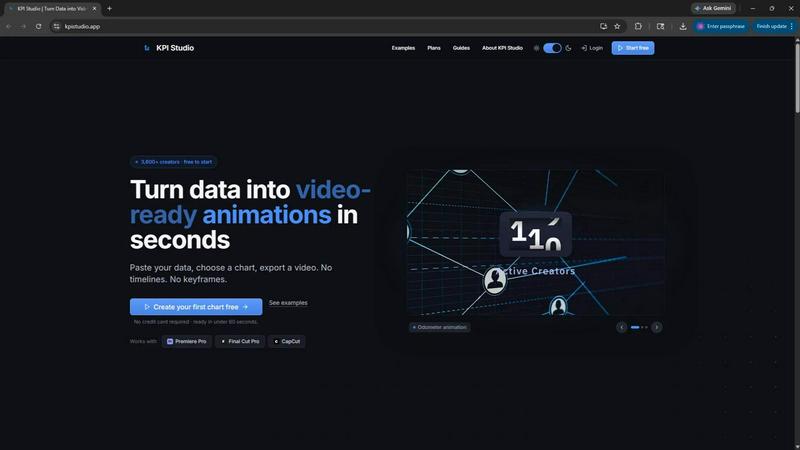
Transform your data into stunning video animations in seconds with KPI Studio, no design skills needed.
AI tool Details
Explore More
Alternatives
About KPI Studio
KPI Studio is an innovative solution designed specifically for data-driven video creators who require the seamless integration of animated charts into their content without the extensive time commitment typically associated with motion design. This groundbreaking tool addresses the common frustrations of video creators who struggle with outdated workflows, often relying on amateurish screenshots or cumbersome design software. With KPI Studio, creators can simply paste their data, select a chart type, and export a fully animated, video-ready visual in under 60 seconds. This rapid turnaround is invaluable for those on tight publication schedules, ensuring that charts are always ready when needed. Furthermore, KPI Studio supports advanced workflows with JSON export options, allowing for deeper editing and integration into custom pipelines, making it the ultimate asset for content creators who prioritize efficiency and high-quality visuals.
Features
Fast and Intuitive Workflow
KPI Studio streamlines the entire animation process, enabling users to paste their data, customize their charts, and export video-ready animations in less than 60 seconds. This eliminates the need for complex timelines or keyframes, allowing creators to focus on their content rather than technical details.
Versatile Export Options
KPI Studio offers a range of export formats including MP4, MOV, GIF, and PNG with transparent backgrounds. This versatility ensures that animated charts can be seamlessly integrated into popular editing software like Premiere Pro, Final Cut, and CapCut, ready for immediate use without further editing.
Real-Time Data Integration
The platform allows for easy re-exporting of charts whenever data changes, ensuring that creators can quickly update their visuals without the hassle of redoing animations. This feature is crucial for those who need to keep their content up-to-date with the latest metrics.
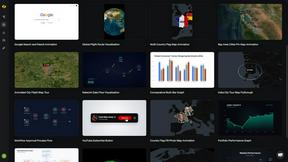
Multiple Chart Types
KPI Studio provides a diverse selection of chart types including growth counters, animated bar charts, and line graphs. This variety empowers creators to visually represent their data in the most effective way, tailored to their specific storytelling needs.
Use Cases
Social Media Content Creation
Content creators on platforms like Instagram and TikTok can utilize KPI Studio to generate eye-catching animated charts that enhance engagement and retention. With dynamic visuals, creators can effectively communicate metrics and messages, capturing audience attention.
Client Projects
Freelancers and agencies can leverage KPI Studio for client projects, allowing for the quick production of high-quality animated visuals. The tool's simplicity and speed make it a valuable asset for meeting tight deadlines without sacrificing quality.
Educational Videos
Educators and trainers can enhance their video presentations with animated KPIs, making complex data more accessible and engaging for learners. This visual approach aids in information retention and improves the overall educational experience.
Marketing Campaigns
Marketers can use KPI Studio to create compelling visuals for reports and promotional videos. By showcasing data in an engaging format, they can better convey their success metrics and attract potential clients or customers.
Frequently Asked Questions
How quickly can I create a chart with KPI Studio?
With KPI Studio, you can create a fully animated chart in under 60 seconds. Simply paste your data, customize your chart, and export it for immediate use.
What types of charts are available in KPI Studio?
KPI Studio offers various chart types, including growth counters, animated bar charts, and self-drawing line graphs, allowing you to choose the best format for your data.
Can I use KPI Studio with my existing video editing software?
Yes, KPI Studio exports charts in multiple formats like MP4, MOV, and GIF, with transparent backgrounds, ensuring compatibility with popular video editing software such as Premiere Pro, Final Cut, and CapCut.
What happens if my data changes after I’ve created a chart?
If your data changes, you can simply re-export the chart with the updated information without needing to redo any animations, making it easy to keep your visuals current.
Similar to KPI Studio
Easymotion - AI Motion Graphic Generator
AI motion graphics and map animation generator for content creators, editors, founders and marketers.
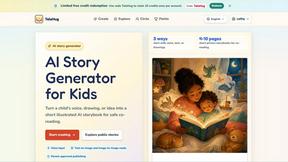
TaleHug AI Story Generator for Kids
Create customizable AI-powered picture-first stories for kids with ease.
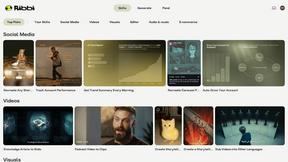
Ribbi
Revolutionize your social media strategy with Ribbi, your self-evolving AI agent that automates content creation and boosts engagement effortlessly.
MStudio
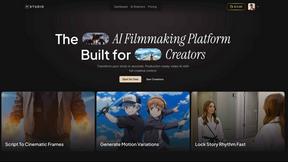
MStudio transforms your scripts into stunning storyboards and pitch-ready campaigns, unlocking cinematic potential at production speed.

Alma by Olivares AI
Alma is your AI assistant that remembers, researches, and creates across image, video, and music—all under one simple monthly plan.
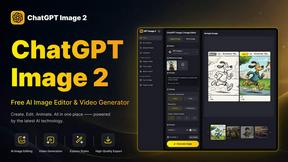
ChatGPT Image 2
Unlock a transformative creative hub where AI image editing, generation, and video creation merge into one seamless commercial-grade workflow.

FeedMansion
FeedMansion transforms your content into tailored social media posts, saving you time and effort while boosting your online presence.

Video Database
Transform your content strategy with our curated video database, featuring analysis and inspiration from top-performing creator videos.